Our latest quarterly reviews of global office and logistics capital markets explore the appetite for deal-making across key EMEA, North America, and APAC markets.
Welcome
Taking Stock
A review of global real estate capital markets, Q2 2024
Oliver Salmon
Director, World Research Global Capital Markets
Rasheed Hassan
Head of Global Cross Border Investment Global Capital Markets
download the full report
We hope you enjoy our latest review of global real estate capital markets.
EXPLORE THE REPORT
Global outlook
Regional outlook
Market view
GLOBAL OUTLOOK
Savills 2024
Back to the top
An interest-rate driven downturn in real estate capital markets may soon give way to an interest-rate driven recovery. The eagerly anticipated pivot in monetary policy is finally upon on, with many global central banks now feeling more at ease with the outlook for inflation. Sentiment in the market has already noticeably improved, while various indicators across pricing and activity metrics would suggest that the bottom is either already behind us, or very close to being behind us.
Sign up to our Global Capital Markets Newsletter
‘The week in review’ is our take on the major global macro events of the week, and their implications for real estate.
Sign up now
next page
Annual Review
Living
Logistics
Offices
regional OUTLOOK
Director, World Research
The IMF expects global GDP growth in 2024 to remain stable.
3.2%
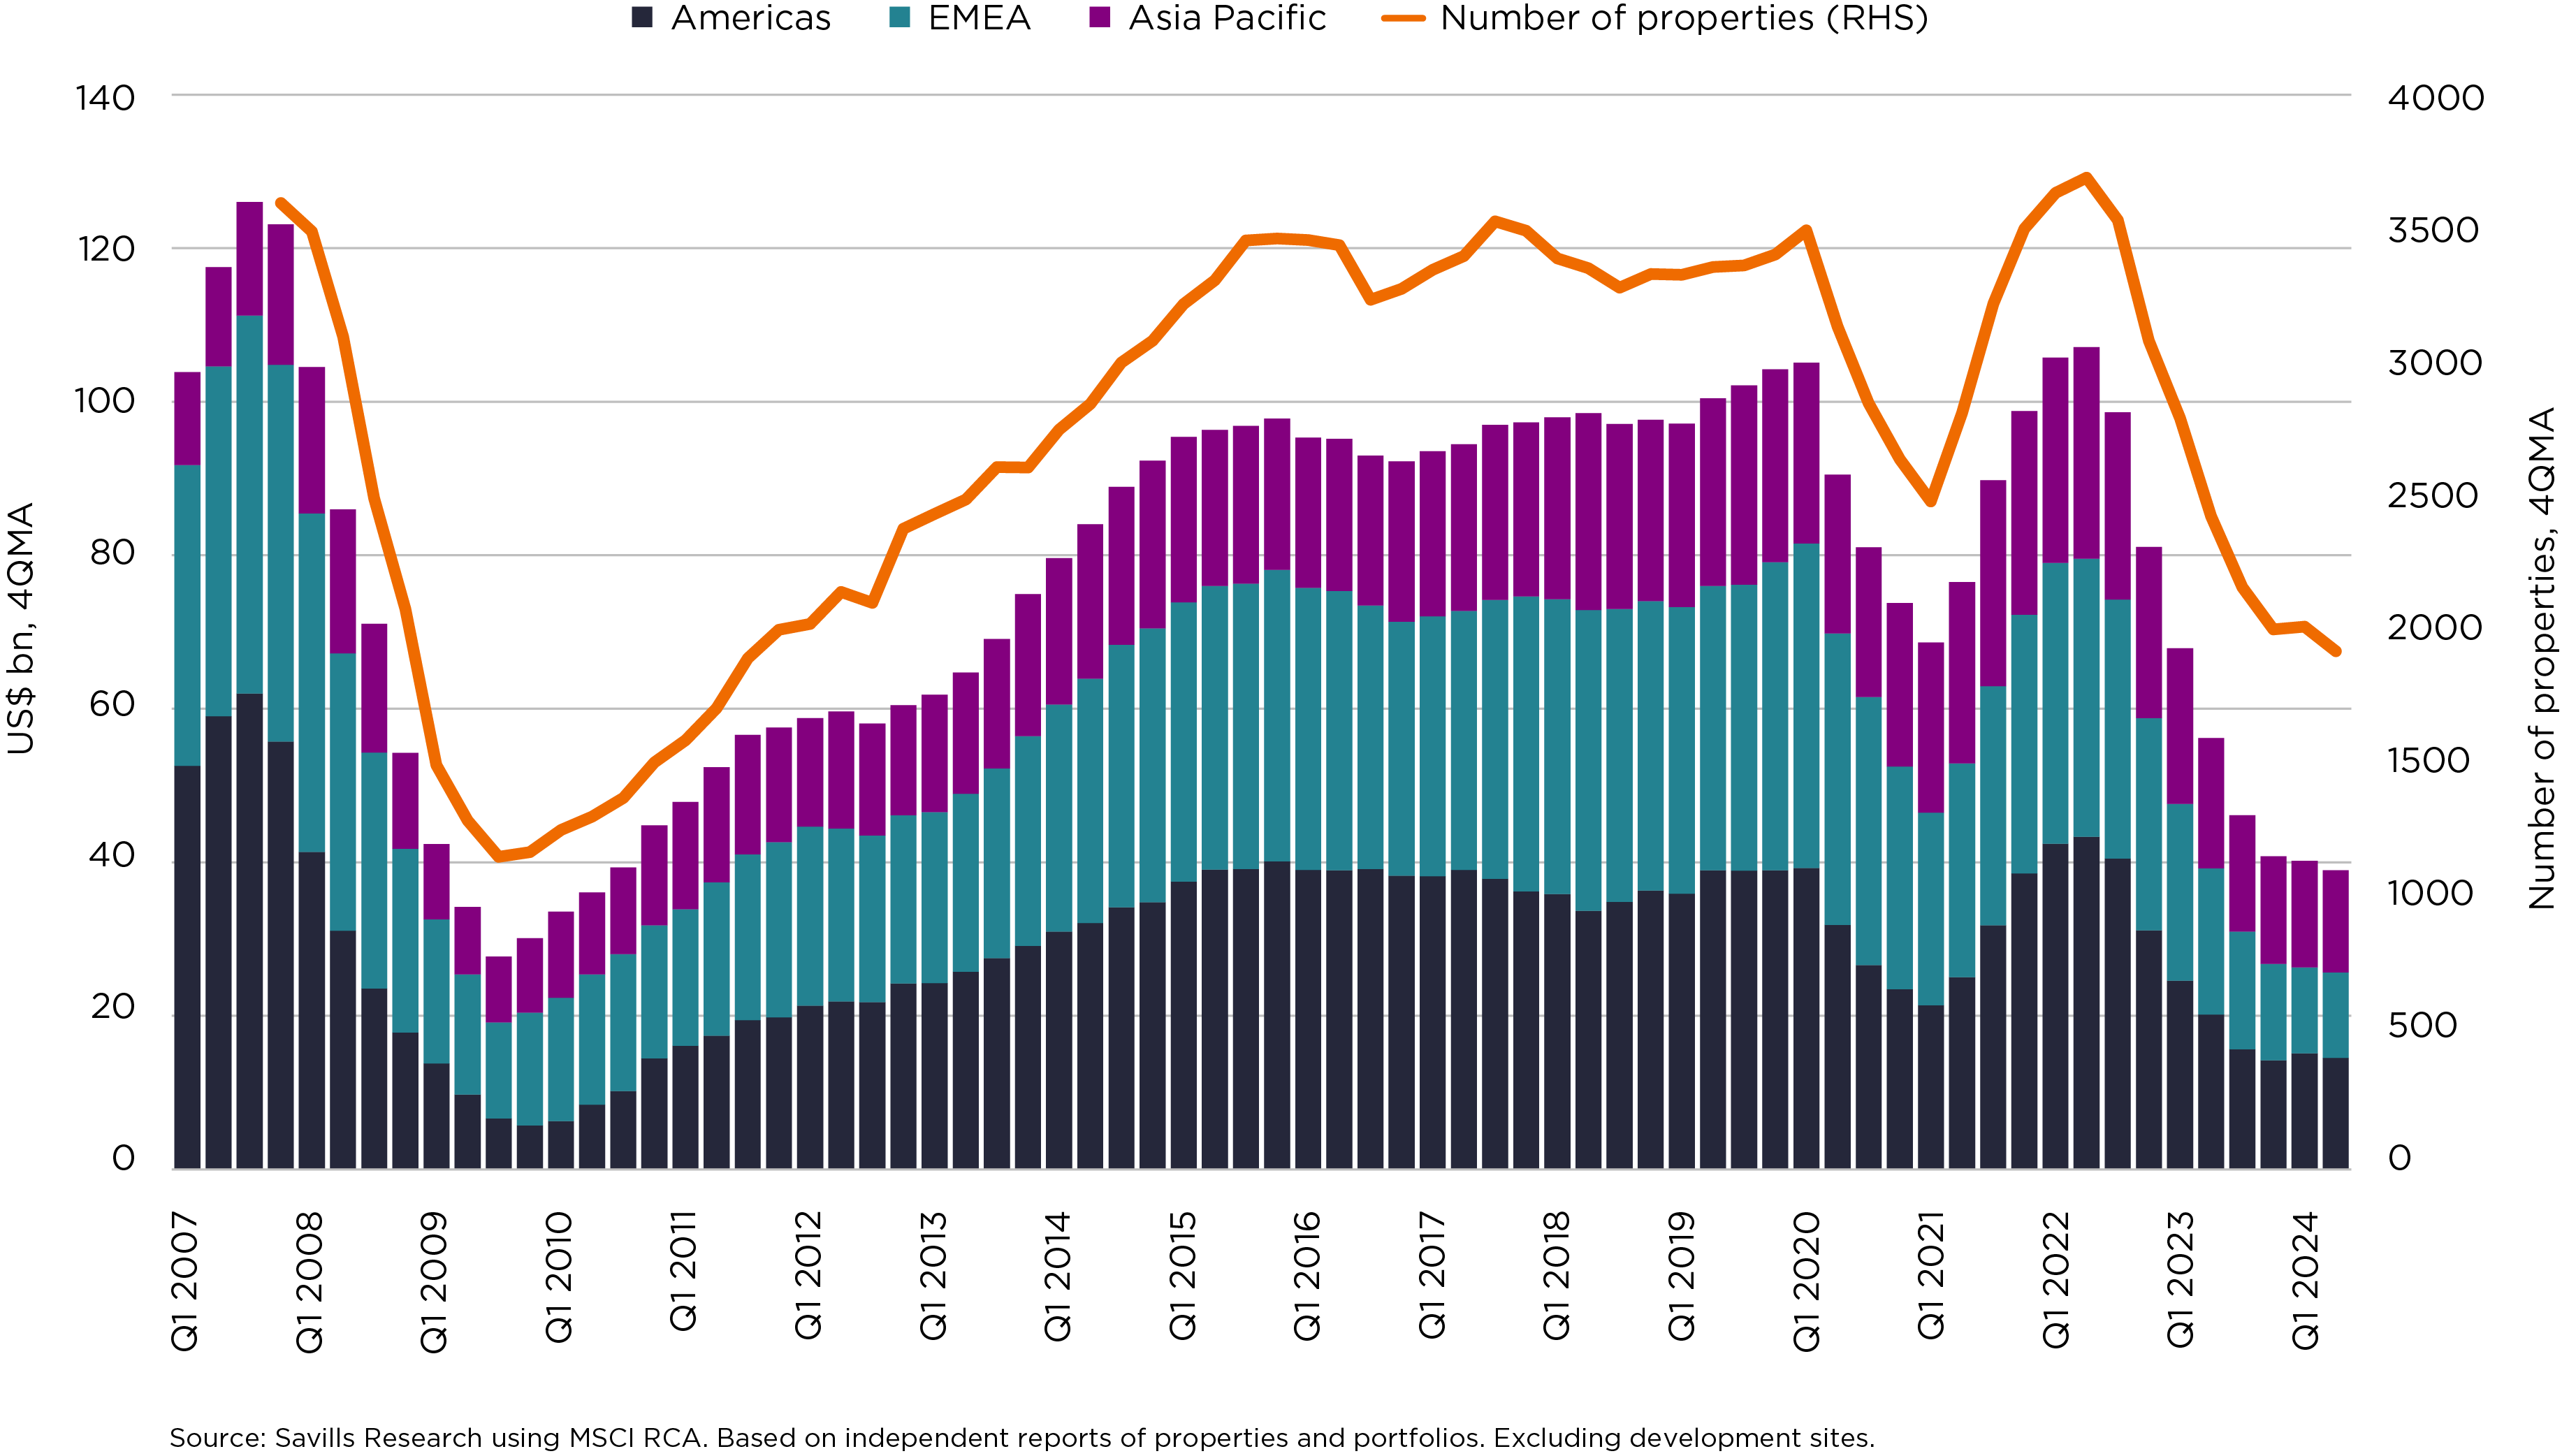
Global office investment fell by nearly 10% y/y in Q2 2024.
US$36bn
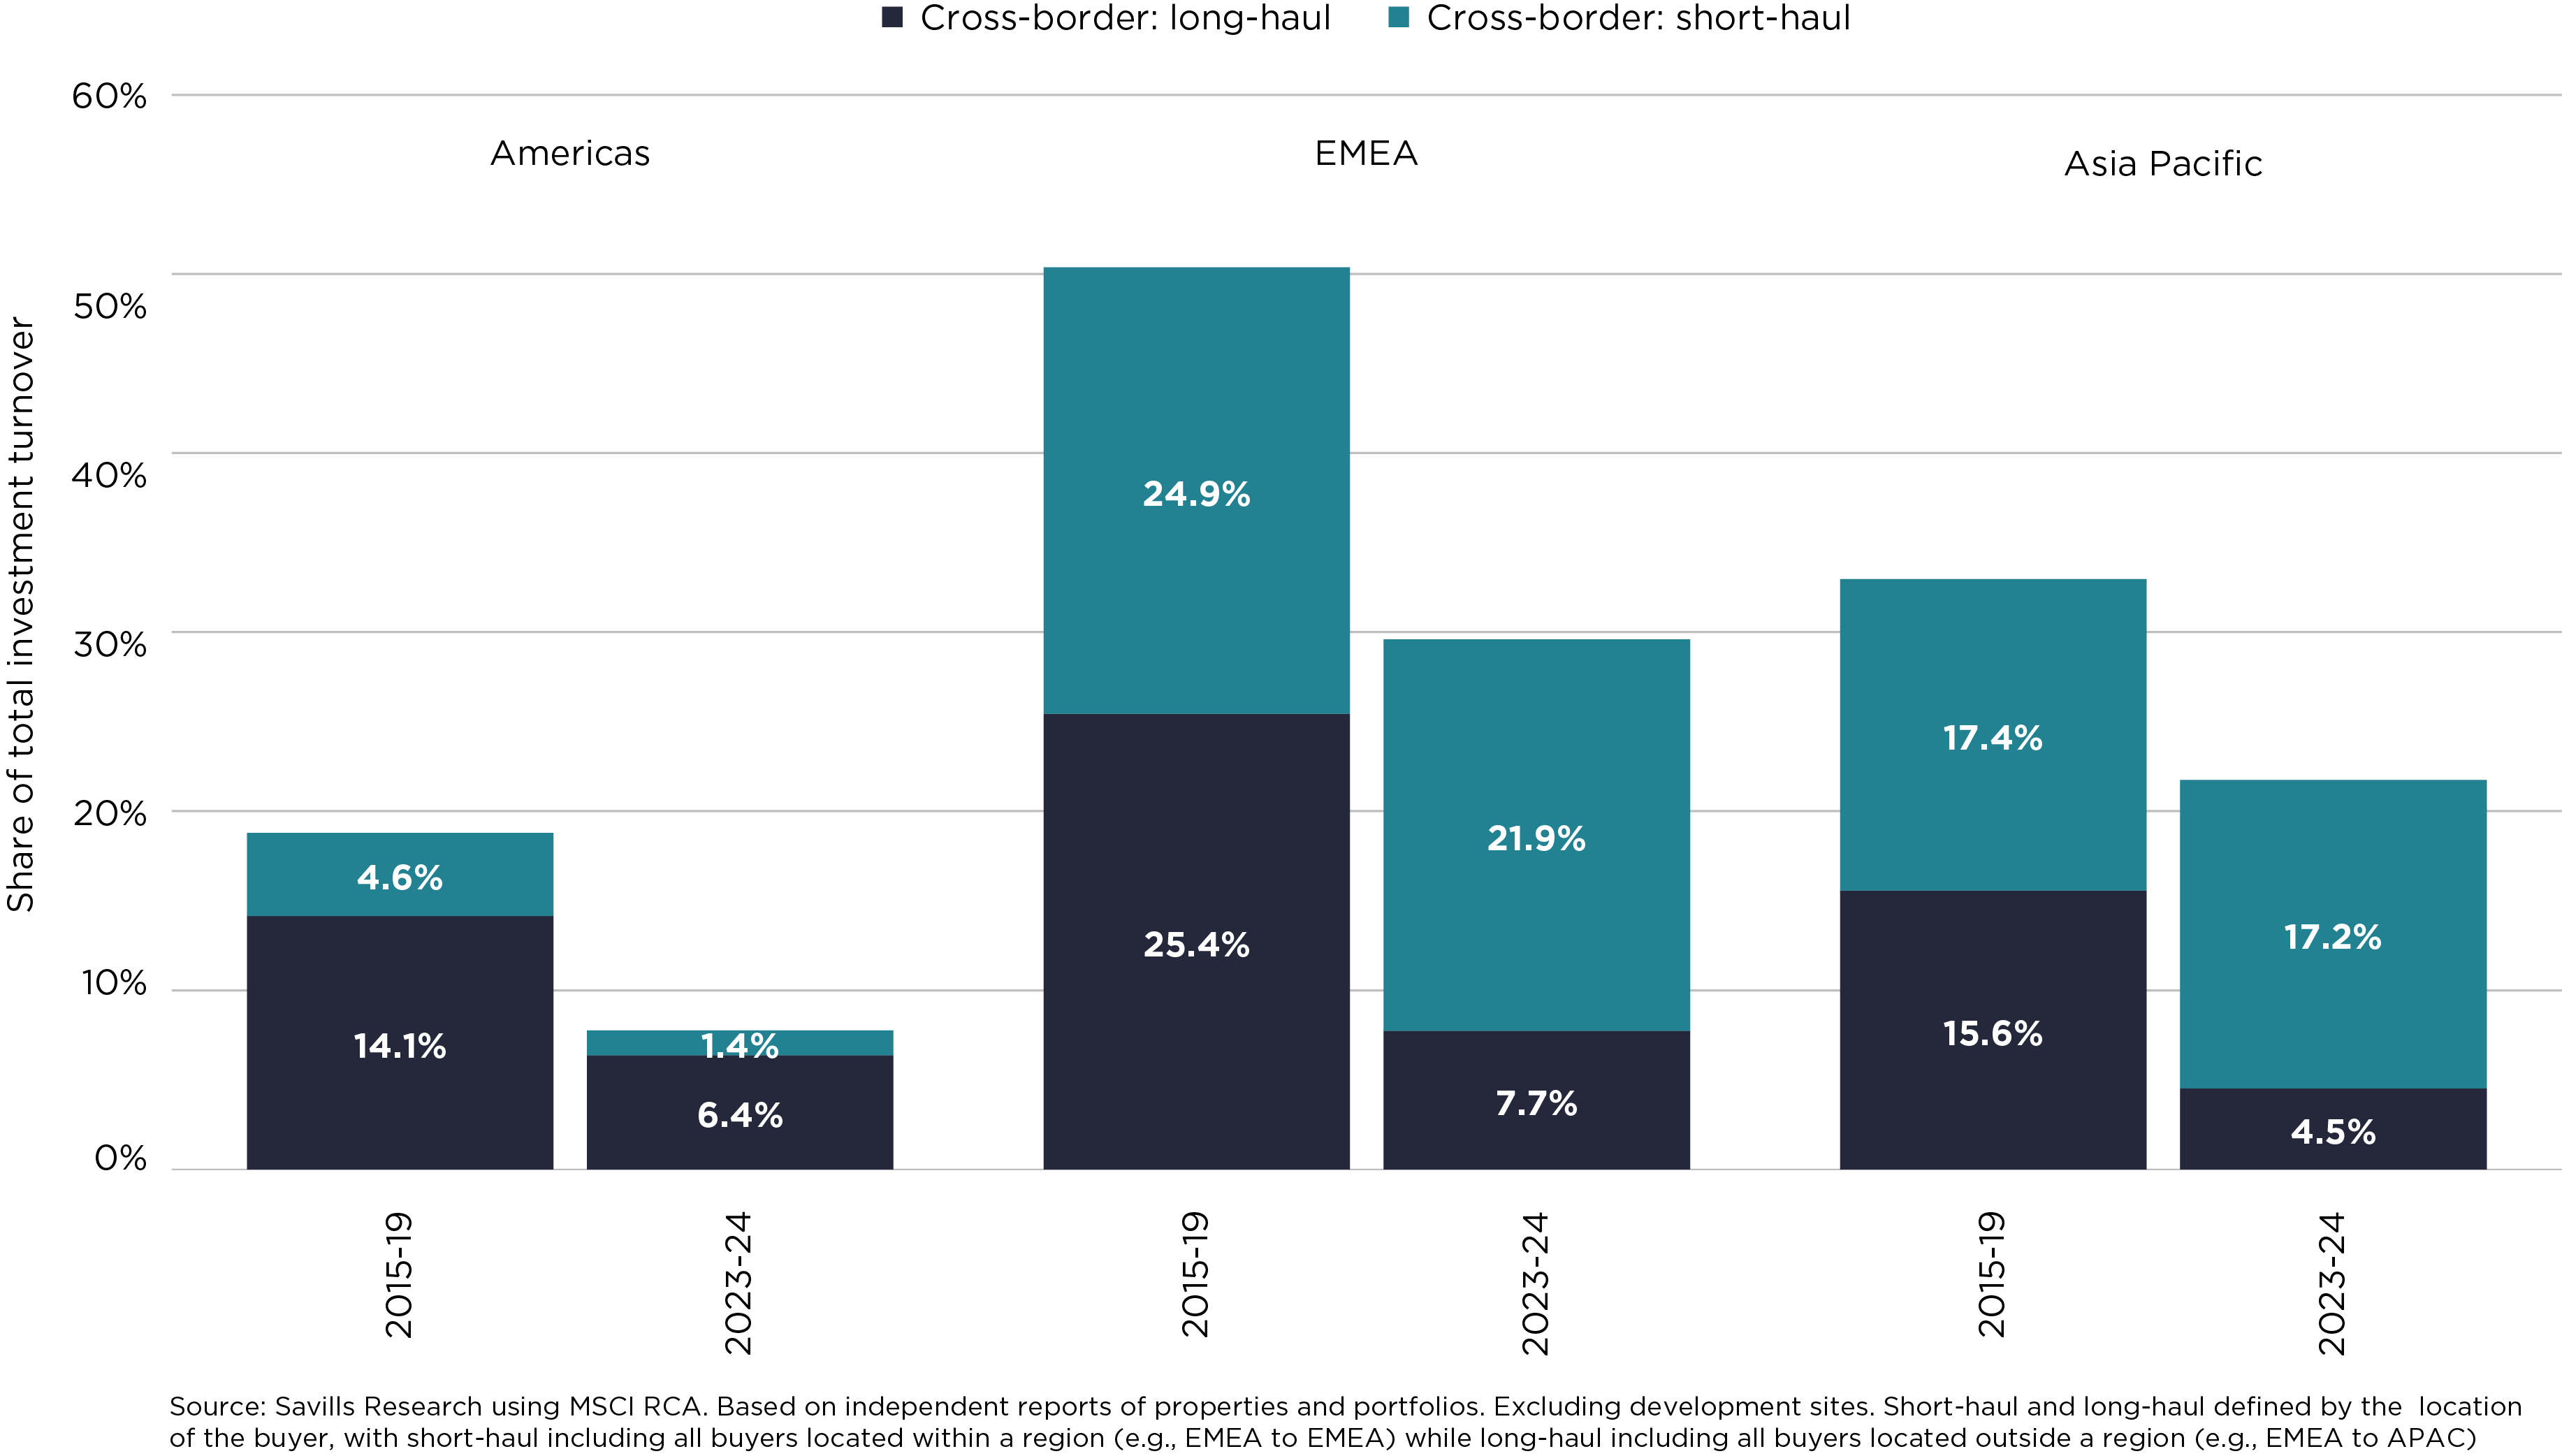
The share of investment backed by cross border investors year-to-date is half the long-term average.
16.1%
While the monetary policy backdrop remains restrictive, we are now at the beginning of an easing cycle that will support growth in the coming years. Headline inflation is trending back to target, supported by disinflation in energy and goods prices. Services price inflation remains elevated in most economies, underpinned by strong nominal wage growth. But labour market dynamics are such that central banks are increasingly confident that the diminished risk of persistent inflation favours a more relaxed policy setting. In early June, the Bank of Canada became the first central bank of the G7 group of major economies to cut interest rates, swiftly followed by the ECB. Others are expected to follow; the Bank of England cut rates in August, while the US Fed is hinting at a September move. The PBoC in China has continued to ease policy rates, elongating an easing cycle that was trigged by the Covid-19 pandemic, and exacerbated by a property market downturn that will drag on the economy for years to come.
The global economy continues to track expectations
Elsewhere in Asia Pacific, central banks are likely to follow the US Fed, particularly in those markets sensitive to exchange rate volatility, such as South Korea. Japan, meanwhile, is looking to move in the opposite direction, while the Reserve Bank of Australia is keeping all options open, following a resurgence in inflation that may require another rate hike before the year end. We are, however, reminded that this is not a normal cycle, and the path back to neutral may take several years. The global economy has shown a remarkable resilience to a series of major shocks over the last few years, but with this resilience comes the monotony of an uninspiring recovery, with implications for global real estate markets. The IMF is forecasting global growth to remain broadly unchanged at 2023 levels for the next three years, albeit there is some rotation expected across advanced economies; as we move in to 2025, a more concerted recovery in Europe will substitute a mild slowdown in the US.
Global office investment turnover
Total office investment fell further in the second quarter, down nearly 10% on the year to US$36bn. The US$78bn transacted in the first six months of 2024 was the lowest H1 outturn in 14 years, and represents a near 60% decline on the 2015-19 average. Private investors remain the dominant buyer group at the beginning of this year, while owner-occupiers continue to be more active, looking to capitalise on the ongoing correction in values. Cross border investors, by contrast, have largely withdrawn from global office markets. Foreign investors have offloaded a net US$7.5bn in assets so far this year, in what is a sharp reversal of the pre-Covid trend of being large net buyers (in contrast, they remain net buyers of other core sectors). From a transactional perspective, long-haul capital in particular has been largely absent from the market, accounting for just 5% of all deals by value this year, down from a longer-term average of around 15-20%. Some of these investors are looking closer to home; the US$23bn of domestic investment backed by institutions in the first half of this year represents around 75% of their total spend last year. But many global institutions have continued to sit on their hands, or revisit their exposure to offices and reallocate to other sectors. This is also evident in the fundraising data, with capital raised by dedicated office funds falling by more than 60% y/y in the first half of 2024.
The outlook for pricing is a little more encouraging. Trends in occupier demand have supported the prime end of the market throughout this cycle, driving solid rental growth, particularly in those markets where supply is limited. Yields have largely topped out as a result, with some markets now expecting to see them compress over the next 12 months as interest rates come down, including in London. The only significant shift in our benchmark yields this quarter was in Sydney, with yields moving out by a further 25bps, but this is more a function of a lagged adjustment in valuations rather than any unique weakness. A few markets may see some further outward movement – such as in China, where the supply-demand balance remains very challenging. While the backward-looking transactional data paints a relatively sombre picture, the outlook on pricing and values points to a slowly shifting narrative. Investors are now more comfortable with the value proposition of offices; supported by the resilience in occupational markets. In many markets such as Japan and London, it is more a lack of stock that is preventing a recovery in activity, rather than a lack of demand. Good assets are seeing greater buyer competition, but many landlords lack a motivation to sell. We will probably need to see a combination of lower interest rates and perhaps some yield compression before we see more core money transact. In the interim, the opportunities lie in finding those landlords that are under pressure to offload assets.
Besieged office market turning a corner
Prime office yields, Q1 2024
Los Angeles 8.00%
Sydney 5.85%
Shanghai (Lujiazui) 4.50%
Hong Kong 1.82%
Tokyo 2.60%
Singapore 3.60%
Seoul 4.25%
New York 5.00%
Paris 4.25%
Frankfurt 4.50%
Madrid 4.90%
London (City) 5.25%
Dubai 6.75%
Sydney
Shanghai (Lujiazui)
Frankfurt
Tokyo
Hong Kong
Singapore
Los Angeles
Paris
London (City)
Madrid
Dubai
New York
Seoul
Prime yield
Outlook for yields, next 12 months
Typical LTV
All-in cost of debt
Cash-on-cash yield
Risk premium (over gov bonds)
Source: Savills Research and Macrobond. Note: Yields may be different to quoted values in markets where the convention is to use a gross rather than net value. Values based on end-of-quarter data. See Methodology for details.
Net initial yields are estimated by local Savills experts to represent the achievable yield, including transaction and non-recoverable costs, on a hypothetical grade A building located in the CBD, over 50,000 sq ft in size, fully let to a single good profile tenant on a long lease. The typical LTV and cost of debt represent the anticipated competitive lending terms available in each market. Cash-on-cash returns illustrate the initial yield on equity, assuming the aforementioned LTV and debt costs. The risk premium is calculated by subtracting the end-of-period domestic ten-year government bond yield (as a proxy for the relevant risk-free rate of return) from the net initial yield. Data is end-of-quarter values.
(as at end-March)
Methodology
welcome
Mumbai 8.25%
Mumbai
Sydney 53%
Shanghai (Lujiazui) 50%
Frankfurt 55%
Tokyo 60%
Hong Kong 40%
Singapore 50%
Los Angeles 53%
Paris 55%
London (City) 55%
Madrid 50%
Dubai 50%
Mumbai 60%
New York 53%
Seoul 63%
Sydney 6.00%
Shanghai (Lujiazui) 4.00%
Frankfurt 4.40%
Tokyo 1.00%
Hong Kong 6.50%
Singapore 4.45%
Paris 4.40%
London (City) 5.86%
Madrid 4.80%
Dubai 8.00%
Mumbai 9.50%
New York 8.00%
Seoul 4.90%
Sydney 5.68%
Shanghai (Lujiazui) 5.00%
Frankfurt 4.51%
Tokyo 5.00%
Hong Kong -1.30%
Singapore 2.75%
Paris 4.07%
London (City) 4.50%
Madrid 5.00%
Dubai 5.50%
Mumbai 6.38%
New York 1.68%
Seoul 3.17%
Sydney 1.88%
Shanghai (Lujiazui) 2.21%
Frankfurt 2.21%
Tokyo 1.87%
Hong Kong -1.89%
Singapore 0.49%
Los Angeles 3.80%
Paris 1.43%
London (City) 1.33%
Madrid 1.75%
Dubai 2.55%
Mumbai 1.19%
New York 0.80%
Seoul 0.84%
Milan 4.25%
Milan
Milan 55%
Milan 3.33%
Milan 0.55%
Vendor Nationality: Singapore Purchaser: PAG Purchaser Nationality: Hong Kong Comments: Transaction represents the largest Singapore office deal completed in two years. The vendor is planning to use the proceeds of the divestment to reduce their debt burden. The sale represents a 14% increase on the purchase price from 2013.
City: Singapore Building: Mapletree Anson Tenant: 17 tenants including Goldman Sachs, Allied Insurance, Danone, and WeWork Lease Length (WAULT): 3.8 years Area: 320,000 sqft Price/NIY: SGD 775mn (US$ 566mn)/3.8% Vendor: Mapletree (MPACT)
key transactions
Vendor Nationality: US Purchaser: Bloomberg Purchaser Nationality: US Comments: In the largest US office transaction year-to-date (excluding portfolio deals), a company linked to Bloomberg purchased the property for occupancy.
City: New York Building: 980 Madison Tenant: Bloomberg Philanthropies Lease Length (WAULT): N/A Area: 130,000 sqft Price/NIY: US$ 560mn/Undisclosed Vendor: RFR Reality
Vendor Nationality: Belgium Purchaser: Government of Belgium Purchaser Nationality: Belgium Comments: With the European Commission aiming to reduce its office footprint by 25% by 2030, the Government of Belgium, via its Sovereign Wealth Fund, will renovate the buildings and redevelop some to create more housing and social spaces, as part of a wider push to revitalise the area.
City: Brussels Building: EU Commission Office Portfolio of 23 buildings Tenant: European Commission Lease Length (WAULT): N/A Area: 3.7mn sqft Price/NIY: €900mn (US$970mn)/Undisclosed Vendor: EU Commission
While the backward-looking transactional data paints a relatively sombre picture, the outlook on pricing and values points to a slowly shifting narrative.
Sign up noW
previous page
Distressed sales are yet to really build across the region, however those markets that have seen the largest value correction are unsurprisingly also experiencing the greatest difficulties.
Total investment across the EMEA region was broadly stable in the second quarter. However, activity was flattered by a single large portfolio deal, with the Belgium Government purchasing a portfolio of assets from the European Commission for €900mn (US$971mn). Based on individual property transactions, turnover was down by around 11% y/y. Cross border investors remain largely conspicuous by their absence. Around one-quarter of deals this year have been backed by foreign capital, down from longer term average of around 50%. Long-haul investors are almost non-existent; less than 5% of transactions were backed by investors based outside the region. Some US investors are understood to be back in the market however (primarily in London). In the interim, intra-regional flows are holding up, supported by the French SCPIs – who are increasingly looking at opportunities in the UK – as well as German institutions and Spanish privates. The Italian market has seen a strong start to the year, with investment doubling in the first half. This was underpinned by several notable transactions; Coima purchased a portfolio of three offices in central Rome for around €200mn (US$216mn), with plans to improve the sustainability credentials to achieve BREEAM certification. The positivity is supported by a relatively strong leasing market, underpinned by very low vacancy on grade A buildings, which is also encouraging some speculative development.
Distressed sales are yet to really build across the region, however those markets that have seen the largest value correction are unsurprisingly also experiencing the greatest difficulties. The pressure is most evident in Germany – underpinned by a significant asset repricing, and a weak macroeconomic environment, with the latter feeding into occupational markets; while take-up across the six core city markets is up 4.5% on the year, it remains around 24% lower than pre-pandemic levels. Investment in France was down by nearly 60% on the year in the first half. Political uncertainty will continue to weigh on activity in the traditional quiet summer period, even though the more extreme election outcomes were avoided. But Paris remains a key office market for investors. The UK election result, by contrast, is likely to bring stability to the domestic political environment, and should, in combination with a summer pivot by the Bank of England, support rising activity. Finally, in the Netherlands, while there were no major deals in H1, sentiment is on the recovery, and there are some larger deals in the pipeline. This includes the completion of Cross Towers by a consortium led by asset manager Edge in July for a reported €172mn. There are plenty of requirements in the market, but like much of the region, it is difficult to source new product.
APAC
North America
EMEA
Property Values and Bank Non-Performing Loans (NPLs)
Distress continues to dominate the narrative and weigh heavily on market sentiment… the office sector accounts for around 40% of assets in distress in the US, and there is a growing evidence base of properties selling at significant discounts.
Distressed assets are selling for steep discounts
-70%
US office occupancy has stabilised at half the pre-Covid level
50%
Second quarter investment was 16% down on the year
US$11.3bn
South Korea is probably to hottest office market in the region, if not globally, right now.
Cross border office investment by origin of buyer
In the US, total investment of US$11.3bn in the second quarter was more than 16% down on the year. The year-to-date comparison is more flattering, with total investment up 6.6% y/y. However, this is heavily distorted by the merger of two large medical office REITs in the first quarter. Fundamentally, activity continues to trend at a fraction of pre-Covid levels. Distress continues to dominate the narrative and weigh heavily on market sentiment. According to MSCI, the office sector accounts for around 40% of assets in distress in the US, and there is a growing evidence base of properties selling at significant discounts. This includes 1740 Broadway in New York, which was sold for US$186mn this quarter, representing a 70% discount to the 2014 purchase price. The buyer, Yellowstone Real Estate Investments, is rumoured to be considering a resi conversion. Other examples include 333 West Wacker Drive in Chicago (down 60% in value from the previous sale in 2015), and 1455 Market Street in San Francisco, where one partial stake owner took an 80% haircut from a near US$220mn investment made back in 2015, to exit their share of the property. Occupational markets are more encouraging. Leasing activity is bottoming out, with nationwide occupancy holding steady at around 50% of the pre-pandemic levels since the beginning of 2023. Lease expiries remain a major driver of activity, and the
macroeconomic outlook is less favourable, with office-based employment now trending down in many major markets. But some markets have seen an uptick in activity regardless, such as New York, where leasing volumes rose by nearly 9% in the first half of the year. Even in tech-centric San Francisco, generative AI startups are aggressively expanding their footprint, albeit from a low base. Here, investors are closely watching the sale of 350 Bush Street as a marker for where core pricing has moved. Availability rates are also peaking out, in part due to supply side dynamics rather than demand. Some markets such as LA, New York, and Washington DC, are seeing total office inventory levels fall, but availability rates are extremely high and will take some years to bring down. Class A rents are broadly stable on last year, despite the large amounts of excess supply. Landlords are more inclined to give concessions than to trim rents, and flight-to-quality continues to provide some support for best-in-class assets. In New York, for example, around 70% of all leasing activity is happening at the top end of the market. Where there is distress in capital markets – such as in LA and San Francisco – we are likely to see more aggressive competition for tenants. Dallas-Fort Worth is somewhat of an outlier, with demand steady and broad-based across sectors, class A rents are up in excess of 9% on the year. This bifurcation in the market, in combination with falling interest rates, should support some yield hardening over the next 12 months.
Investment turnover of US$12.0bn across the region was 14% down on the year. The Japanese market was the primary driver of this decline; investment there fell by more than 37% y/y in local currency terms, with fewer deals completed than in any quarter throughout the history spanning 18 years of data. However, this follows a strong start to the year, and activity in the first half remains up on the year. A lack of available stock remains a major impediment to transactional activity in Japan. When new mandates are launched to the market, there is generally no shortage of interest. Nevertheless, cross border investors, particularly from the West, are notably absent; after backing nearly one-quarter of all deals through 2021- 22, investors from North America and Europe have acquired just 2% of deals by value this year. This does however include the largest deal of Q2, with the Canadian investment manager BGO paying JPY44.5bn (US$282mn) to purchase Honmachi Garden City in Osaka from a local REIT, at a yield of 3.4%. South Korea is probably the hottest office market in the region, if not globally, right now. In Seoul, tenant demand is quickly absorbing new vacancy, supporting strong prime rental growth of 5.7% in Q2. With no large prime office projects expected to be delivered to the market until 2025, the current supply-demand imbalance is likely to persist
(particularly in the GBD region). In the near-term, investors remain somewhat circumspect, watching the Bank of Korea (and by implication, the US Fed). But more activity is expected in the second half with several large deals progressing, all likely to complete at yields of 3-4%. In Singapore, while the leasing market is still quiet, investment activity was much stronger in Q2. Rents and vacancy are broadly stable; with the latter supported by zero supply onboarding in H1. Investment in the quarter was boosted by six block transactions, including three in excess of S$100mn (US$73mn). The largest deal was the sale of Mapletree Anson for S$775mn (US$566mn) to PAG, from Mapletree Pan Asia Commercial Trust, at a yield of 3.8%. In Australia, persistent inflation and greater uncertainty around the interest rate outlook are weighing on sentiment. However, steeper declines in asset values are beginning to drive a recovery in activity. The deal flow suggests an increased number of motivated sellers, with a number of major deals settling just before the end of the financial year. The pricing on major office transactions in Sydney and Melbourne indicates that some assets are trading at a discount of up 25% from their peak book values. Investors are keenly waiting for the mid-year valuations from traded REITs to see if this will feed into a broad-based repricing.
market view
Share of investment backed by long-haul capital this year, down from a long-term average of around 25%
4.8%
A single transaction – a portfolio sale in Belgium – accounted for nearly one-tenth of all activity this quarter
9%
Total investment in EMEA was broadly stable on the year in Q2
US$ 11.2bn
Average vacancy rate in Seoul, with a lack of supply supporting above-inflation rental growth.
Deal volumes hit a record low in Q2, based on the number of transactions, spanning data going back to 2007.
39
Total investment was around 14% down on the year in the second quarter.
US$12bn
Prime office yields
(as at end-JUNE)
Head of Global Cross Border Investment
Rasheed Hassan shares his view on the market
regional outlook
An increasing number of markets globally are now unquestionably experiencing a tilt to the positive. In the major markets, with the exception of Japan, interest rates have largely peaked or are at the tail end of their journey, and we are now witnessing eagerly anticipated rate cuts. We are also through a number of the major global elections. Whether investors support the outcomes or not, this provides a level of clarity that they all crave. Lastly we have been on a journey of price falls, pretty unanimously, across geographies and sectors. These now seem to be slowing and in some cases starting to turn. Given all of this, it is not surprising that we are seeing some investors looking at markets with more intent, and finding ways to be more positive in their underwriting. We have reported often that this has been an anomalous downturn, whereby rising rents for prime assets in core locations, including in offices, is set against a backdrop of falling values. This has given the market a strong conviction that this is downturn is largely interest rate driven rather than fundamentals driven. Given where we are in monetary policy cycles, things should be looking up from here. There remains a shortage of committed vendors across all sectors, as the majority of owners want to wait until there are more datapoints to provide strong pricing comparables. But this is coming and it gives us hope that the busy end of year trading season will give the markets what’s needed as a backdrop for greater activity in 2025.
The cap rate vs. cost of money conundrum remains a cause for reticence for some core investors. However, buyers with a long hold horizon are viewing today’s core market pricing as largely ‘fair value’ and those with shorter term strategies are focusing on total returns. The demonstrable and forecast rental growth is a key factor in decision making for the total return buyers, coupled with a belief that the most core assets in the best locations will always be considered scarce and therefore have a deep buyer pool that will keep yields as compressed as possible when it comes to exit. There is also a belief that the pricing disparity between truly prime assets and those with some sort of blemish (location, building quality, lease term, tenure) is too great and will narrow as the markets re-gain confidence. Lastly, I would note that the shortage of investment product is leading to greater buyer interest when something does actually come to the market. In many cases, this is supporting more aggressive underwriting, as those buyers who truly want to get invested know that they have limited choice. As a result, we are seeing a number of processes resulting in more positive pricing outcomes than expected. If owners are considering sales in the next 6 to 12 months, they may give consideration to bringing assets to the market sooner rather than later, taking advantage of the lack of choice that investors are having to grapple with