Taking Stock
An interest-rate driven downturn in real estate capital markets may soon give way to an interest-rate driven recovery. The eagerly anticipated pivot in monetary policy is finally upon on, with many global central banks now feeling more at ease with the outlook for inflation. Sentiment in the market has already noticeably improved, while various indicators across pricing and activity metrics would suggest that the bottom is either already behind us, or very close to being behind us.
Oliver Salmon
Director, World Research Global Capital Markets
Rasheed Hassan
Head of Global Cross Border Investment Global Capital Markets
We hope you enjoy our latest review of global real estate capital markets.
EXPLORE THE REPORT
Global outlook
Regional outlook
Market view
GLOBAL OUTLOOK
Savills 2024
Back to the top
A review of global real estate capital markets, Q2 2024
download the full report
Our latest quarterly reviews of global capital markets explore the appetite for deal-making across EMEA, North America, and APAC.
Welcome
Sign up to our Global Capital Markets Newsletter
‘The week in review’ is our take on the major global macro events of the week, and their implications for real estate.
Sign up now
next page
Annual Review
Living
Logistics
Offices
regional OUTLOOK
Director, World Research
While falling on the year, the transactional market is tracking higher than where it was pre-Covid, with the US$78bn of completed deals in H1 representing over 9% growth from the 2015-19 average.
The IMF expects global GDP growth in 2024 to remain stable.
3.2%
Total industrial & logistics investment fell by 20% y/y in Q2 2024.
US$40.3bn
The average deal size rose increased in Q2.
11%
While the monetary policy backdrop remains restrictive, we are now at the beginning of an easing cycle that will support growth in the coming years. Headline inflation is trending back to target, supported by disinflation in energy and goods prices. Services price inflation remains elevated in most economies, underpinned by strong nominal wage growth. But labour market dynamics are such that central banks are increasingly confident that the diminished risk of persistent inflation favours a more relaxed policy setting. In early June, the Bank of Canada became the first central bank of the G7 group of major economies to cut interest rates, swiftly followed by the ECB. Others are expected to follow; the Bank of England cut rates in August, while the US Fed is hinting at a September move. The PBoC in China has continued to ease policy rates, elongating an easing cycle that was trigged by the Covid-19 pandemic, and exacerbated by a property market downturn that will drag on the economy for years to come.
The global economy continues to track expectations
Elsewhere in Asia Pacific, central banks are likely to follow the US Fed, particularly in those markets sensitive to exchange rate volatility, such as South Korea. Japan, meanwhile, is looking to move in the opposite direction, while the Reserve Bank of Australia is keeping all options open, following a resurgence in inflation that may require another rate hike before the year end. We are, however, reminded that this is not a normal cycle, and the path back to neutral may take several years. The global economy has shown a remarkable resilience to a series of major shocks over the last few years, but with this resilience comes the monotony of an uninspiring recovery. The IMF is forecasting global growth to remain broadly unchanged at 2023 levels for the next three years, albeit there is some rotation across advanced economies; as we move in to 2025, a more concerted recovery in Europe will substitute a mild slowdown in the US.
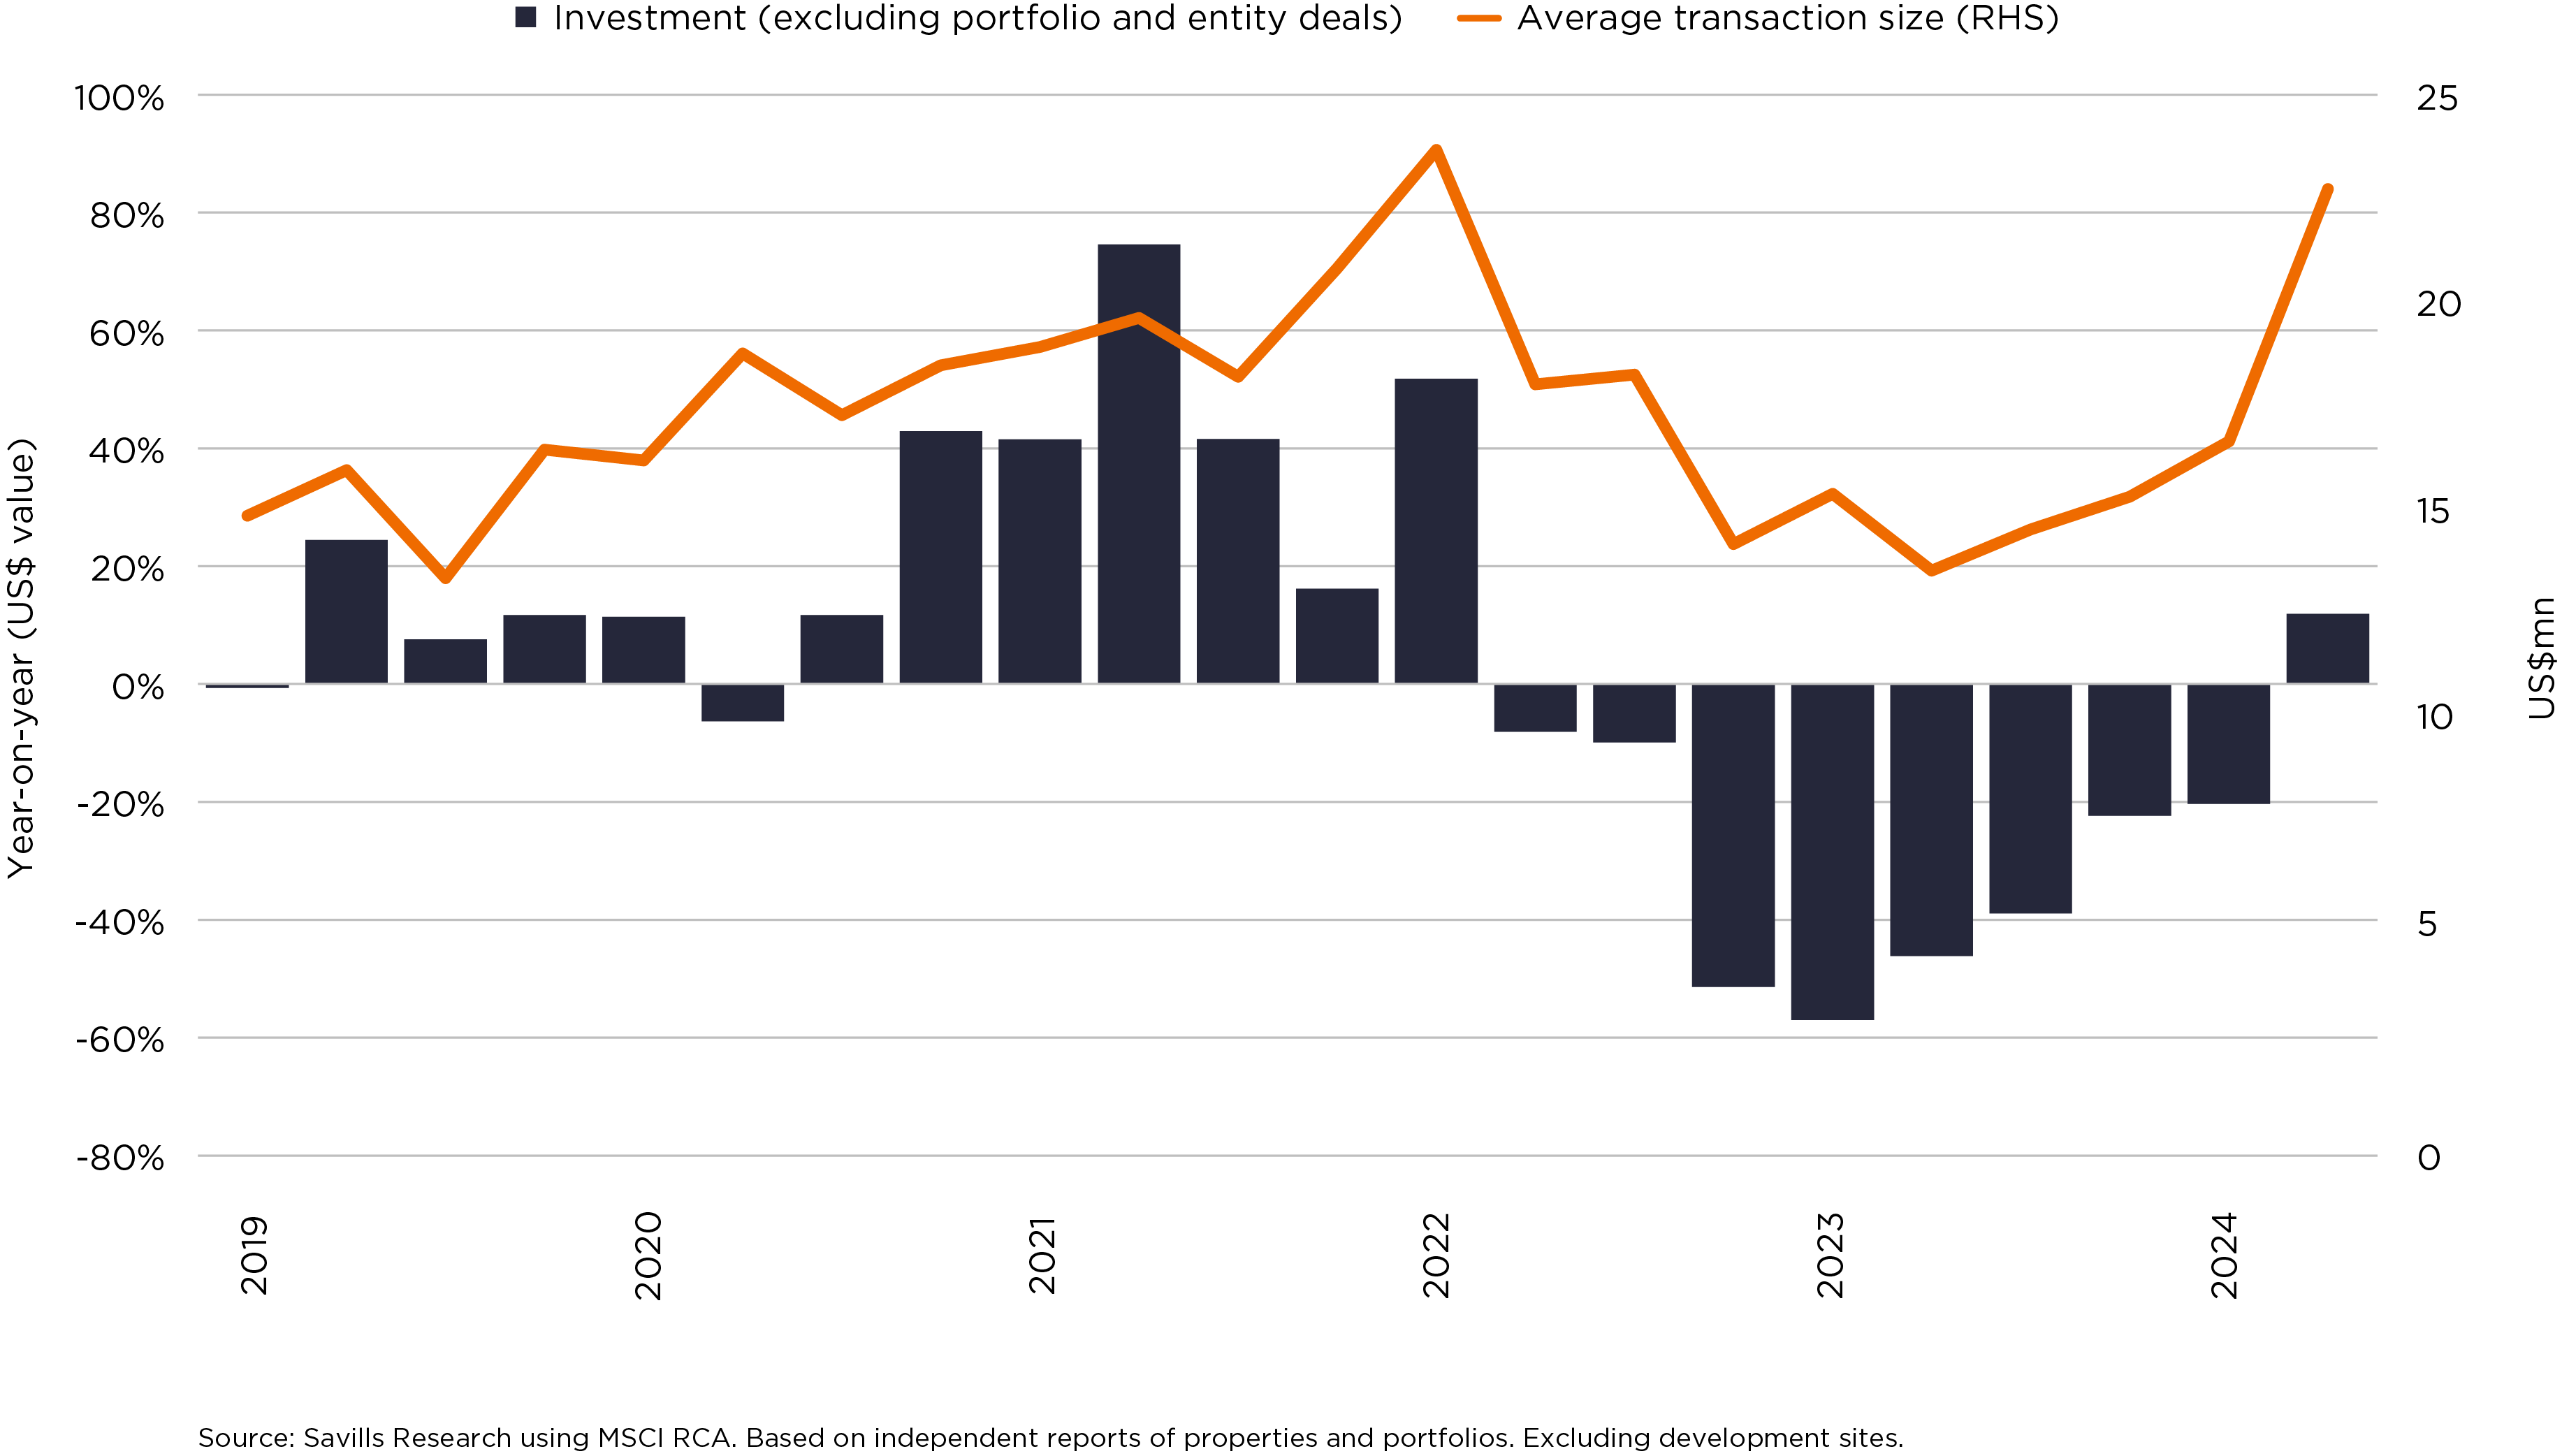
Global logistics investment turnover
Global investment of US$40.3bn in industrial and logistics assets in the second quarter represented a near 20% decline from a year earlier. This was underpinned by fewer portfolio transactions; total portfolio and entity-level deals, which typically represent around 40% of total activity in any given year, fell by over 45% from Q2 2023. In terms of deals for individual properties, activity held up much better, with turnover down by just 3% in US$ terms. While falling on the year, the transactional market is tracking higher than where it was pre-Covid, with the US$78bn of completed deals in H1 representing over 9% growth from the 2015-19 average. Assuming this represents the trough in this cycle, then we can expect the market to rebase higher in the future. This is supported by a shift in investor allocations favouring the sector, and is reflected in the fundraising data, with the US$41.5bn raised globally in the first half of this year by funds targeting industrial and logistics assets representing a 30% increase on the pre-Covid average (despite the wider challenges around raising capital). The average individual deal size in Q2 rose by around 11% on the previous quarter, suggesting that scale investors are returning to the sector. This is supported by a recovery in buy-side activity from cross border investors, the only
major investor group to be net buyers of industrial and logistics space year-to-date. Cross border investors have already backed some of the largest deals this year, including Brookfield’s agreed purchase of a 14.6mn sqft US logistics portfolio from DRA Advisors for a reported US$1.3bn, only the third recorded deal in the US surpassing the billion-dollar mark so far this year (across all sectors). Prime yields look to have stabilised across Europe and North America, with some markets already seeing some yield compression. But there remains a scarcity of core money in some markets, including much of Europe, as well as in Australia. Those underwriting deals in the current climate need to look through a softening occupational market. In many cases, this is underpinned by the onboarding of new supply. The development cycle typically lags that of the business cycle, and new starts originated in 2022-23 are now hitting a market where tenant demand is noticeably weaker than in recent years. In the US, for example, the vacancy rate hit a 10-year high of 7.1% in the second quarter, while average vacancy across European markets has risen by more than 200bps in the last 12 months. Rental growth has slowed as a result, and more tenant favourable conditions will likely persist in the short term.
Industrial and logistics transactional activity rebasing higher post-Covid
Prime logistics yields, Q2 2024
Houston 6.00%
Los Angeles 5.25%
Sydney 5.25%
Chicago 5.75%
Shanghai 5.00%
Hong Kong 3.84%
Tokyo 3.30%
Singapore 6.35%
Seoul Metropolitan Area 5.50%
Northern New Jersey 5.25%
Île-de-France 4.75%
Amsterdam 4.75%
Cologne 4.40%
Madrid 5.05%
London 5.00%
Dubai 7.50%
Houston
Sydney
Shanghai
Amsterdam
Cologne
Tokyo
Hong Kong
Singapore
Los Angeles
Chicago
Île-de-France
London
Madrid
Dubai
Northern New Jersey
Seoul Metropolitan Area
Houston 60%
Sydney 53%
Shanghai 40%
Amsterdam 55%
Cologne 55%
Tokyo 60%
Hong Kong 40%
Singapore 50%
Los Angeles 60%
Chicago 60%
Île-de-France 55%
London 55%
Madrid 50%
Dubai 50%
Northern New Jersey 60%
Seoul Metropolitan Area 63%
Houston 7.25%
Sydney 6.15%
Shanghai 4.00%
Amsterdam 4.40%
Tokyo 1.00%
Hong Kong 6.50%
Singapore 4.45%
Los Angeles 7.25%
Chicago 7.25%
Île-de-France 4.40%
London 5.30%
Madrid 4.80%
Dubai 8.00%
Northern New Jersey 7.25%
Seoul Metropolitan Area 5.90%
Houston 4.13%
Sydney 4.26%
Shanghai 5.67%
Amsterdam 5.18%
Tokyo 6.75%
Hong Kong 2.07%
Singapore 8.25%
Los Angeles 2.25%
Chicago 3.50%
Île-de-France 5.18%
London 4.63%
Madrid 5.30%
Dubai 7.00%
Northern New Jersey 2.25%
Seoul Metropolitan Area 4.83%
Houston 1.80%
Sydney 1.28%
Shanghai 2.71%
Amsterdam 2.16%
Cologne 2.11%
Tokyo 2.57%
Hong Kong 0.13%
Singapore 3.24%
Los Angeles 1.05%
Chicago 1.55%
Île-de-France 1.93%
London 1.08%
Madrid 1.90%
Dubai 3.30%
Northern New Jersey 1.05%
Seoul Metropolitan Area 2.09%
Prime yield
Outlook for yields, next 12 months
Typical LTV
All-in cost of debt
Cash-on-cash yield
Risk premium (over gov bonds)
Source: Savills Research and Macrobond Note: Yields may be different to quoted values in markets where the convention is to use a gross rather than net value. Values based on end-of-quarter data. Yields in Singapore reflect the domestic land tenure system, where the longest lease for new industrial properties is 30 years. See Methodology for details.
Net initial yields are estimated by local Savills experts to represent the achievable yield, including transaction and non-recoverable costs, on a hypothetical Grade A big-box logistics facility located in a prime location, fully let to a single good profile tenant on a 10-15 year open market lease. The typical LTV and cost of debt represent the anticipated competitive lending terms available in each market. Cash-on-cash returns illustrate the initial yield on equity, assuming the aforementioned LTV and debt costs. The risk premium is calculated by subtracting the end-of-period domestic ten-year government bond yield (as a proxy for the relevant risk-free rate of return) from the net initial yield. Data is end-of-quarter values.
(as at end-june)
Methodology
key transactions
City: UK Building: International Trading Estate, Brent Road Tenant: Multiple Lease Length (WAULT): Undisclosed Area: 890,000 sqft Price/NIY: £315mn (US$ 398mn)/Undisclosed Vendor: Royal London Asset Management
Vendor Nationality: UK Purchaser: Global Technical Realty Purchaser Nationality: UK Comments: Buyer is a UK data centre developer backed by US private equity group KKR. Current site, comprising 30 individual units, will be repurposed into a data centre, adding to their existing 40.5MW UK data centre campus in Slough.
City: Australia Building: Goodman Australia Logistics Portfolio Tenant: 17 tenants including Metcash, Super Retail Group, Pack Rack, Iron Mountain, and Amazon Lease Length (WAULT): Undisclosed Area: 3.66mn sqft Price/NIY: AUD780mn (US$505mn/5.0% Vendor: Goodman Group
Vendor Nationality: Australia Purchaser: Barings and Rest Super JV Purchaser Nationality: US and Australia Comments: This 12 property portfolio spread across Sydney and Melbourne includes the largest logistics facility in Australia, a 1.24mn sqft ‘mega shed’ in Melbourne, a purpose-built distribution centre for the wholesale company Metcash. Barings and Rest Super announced a AUD1.0bn partnership in 2023.
welcome
previous page
Pressure to spend is now very evident in the market, and pricing has bottomed out, absent further economic shocks… in some markets, prime yields are now moving back in.
Investment of US$9.5bn across the EMEA region was nearly 14% down on the year in Q2. This was, however, driven by weaker activity at the portfolio or entity level, which can be lumpy and volatile. The value of individual property sales, by contrast, increased by around 12% y/y, the first annual rise in two years. The average deal size has also increased, up by around one-third so far this year to €21.0mn (US$22.6mn), suggesting that investors are increasingly comfortable deploying at scale in the region. Cross border investors have been the most active buyer group so far this year, accounting for around two-thirds of completed transactions, the highest share since 2017. Around half of all inbound investment originated from US-based investors, including one of the largest deals of the quarter, the £315mn (US$398mn) purchase of International Trading Estate in the UK by an entity backed by the US private equity group KKR, which they are reportedly planning to redevelop into a data centre. Pressure to spend is now very evident in the market, and pricing has bottomed out, absent further economic shocks. Indeed, in some markets, prime yields are now moving back in. The outlook for the next 12 months suggests some further inward movement, particularly across key logistics hubs in the UK, Italy, France, Spain, Sweden, and Denmark. With the ECB and other major central banks in Europe already pivoting on rates, investors are again able to secure accretive financing, with day one cash-on-cash yields in excess of 5% in France, Netherlands, and Spain
The German market is a notable absentee from the above. Here, it is evident that past rental growth is beginning to bite for some occupiers, amidst a difficult operating environment for businesses. Landlords are having to offer more incentives amidst a slowdown in occupational demand, with many tenants in the process of optimising and consolidating the use of their existing space (including greater sale and leaseback activity). While some sales are completing at the prime yield of 4.4% (which is lower than regional peers), there remains a lack of core money in the market. The value-add segment is more active, as it is across Europe, with most investors looking to build or manage to core. In the Netherlands, by contrast, pricing power remains firmly in the hands of landlords, with rental growth of 15.8% y/y in Q2 the strongest of all the core European markets. This is underpinned by a very tight supply backdrop. In the UK, the recovery in investor sentiment is underlined by the merger of Tritax Big Box and UK Commercial Property REIT (UKCM), to form the country’s fifth largest REIT. The merger combines a reported £6.3bnn (US$7.8bn) portfolio of logistics assets, the majority of which is core product.
APAC
North America
EMEA
EMEA investment activity
The occupational market continues to slow in line with the wider economy, with leading indicators sending mixed signals on the outlook for future demand.
The delinquency rate of CMBS linked to logistics is much lower than the all-property average.
0.6%
The nationwide vacancy rate has hit a 10-year high amid a glut in supply.
7.1%
Turnover this quarter was the lowest since Q2 2020.
US$19.9bn
US vacancy and average rents
Cross border investors are the only net buyers across the major investor groups [in APAC], with acquisitions tracking well ahead of this time last year.
prime logistics yields
US investment fell by 14% y/y in Q2, with the US$19.9bn of deals representing the lowest second quarter since 2020. The slowdown in activity was primarily underpinned by a lack of portfolio deals completing in the quarter, with domestic institutional investors disposing of a net US$2.3bn of assets in the first half of this year, after being net buyers for the last six years. The value of individual property transactions was broadly stable, with the largest deal in Q2 backed by the US chipmaker NVIDIA, who paid US$374mn for their Santa Clara headquarters, an R&D park that previously exchanged for US$240mn in 2017. The occupational market continues to slow in line with the wider economy, with leading indicators sending mixed signals on the outlook for future demand (albeit that Amazon is ramping up activity again). In particular, consumer spending is showing some underlying weakness after defying all expectations in recent years. Leasing activity has fallen by around 11% year-to date, with the nationwide vacancy rate hitting a 10-year high of 7.1% in Q2, having risen by 330bps since mid-2022. Construction starts are down by nearly 70% from the 2022 peak, but the market is still facing excess supply that will take around 21/2 years to clear.
These trends are no more apparent than in Los Angeles, which has now experienced seven consecutive quarters of negative net absorption. Rents have fallen by 10% on the year (compared with an average 3.3% increase across the US), although this must be put into context by the 74% rise in rents since 2019. Nevertheless, the weak occupational outlook is reflected in the investment data, with transactional activity down by around 50% in Q2. Rents are also falling in Chicago, albeit by just 2% y/y, while net absorption has remained in positive territory. A sharp decline in new starts from mid-2023 implies a very limited pipeline of new supply onboarding, which will arrest the rise in vacancy (up 220bps since last year to 6.9%), and support pricing. Options for large users are in limited supply in many of the best located and most desirable locations. Houston has been more resilient than many other markets, posting positive net absorption in line with the longer-term average, including some notable deals completing in the quarter. Nevertheless, supply (much of which is speculative) is much greater than demand, so pushing vacancy higher and weighing on the prime yield.
Total investment of US$8.0bn across the APAC region in Q2 was down 34% on the year. However, much like in the other regions, a large decline in portfolio deals underpinned weaker turnover. The half-year comparison makes for better reading, down just 11% on the same period last year, underpinned by a solid start to 2024. Australia and South Korea are the best performing major regional markets, while Singapore is broadly stable. Cross border investors are the only net buyers across the major investor groups, with acquisitions tracking well ahead of this time last year (already over 60% of total spend in 2023). US inbound accounts for around 50% of all cross border investment year-to-date, up from a longer-term average of around 30%. Investors from Hong Kong and Greater China, meanwhile, have already surpassed total commitments last year (maybe linked to some weaknesses in domestic markets). In Australia, the data was somewhat flattered by a single transaction, one of the largest regional deals of the year. Rest Super and Barings purchased a portfolio of 12 assets located in Sydney and Melbourne from Goodman for AUD780mn (US$505mn). When excluding this deal, investment turnover was broadly stable in Q2.
The underlying fundamentals are looking a little weaker as we move through the year. The urgency in leasing demand is falling back from the fervour of 2022-23, and we are expecting to see a spike in vacancy, underpinned by rising sublease space in larger buildings. Rental growth rates have slowed to a standstill in most precincts in Sydney, although it is worth noting that prime rents are still about 90% higher than they were in 2019. Overall, there remains a low level of transactions in the market to benchmark yields from. REITs, superfunds, and privates are the most active buyers. In Japan, while very little transacted in the quarter, the logistics sector remains one with significant growth prospects, and modern facilities located in convenient areas with premium features remain in high demand (when they become available). But a large supply pipeline over coming years, and the prospect of rising interest rates, may temper interest in the sector among some investors. Cross border investors, in particular, will see diminishing arbitrage opportunities from both interest rate differentials and currency, as the Bank of Japan moves in the opposite direction to other global central banks.
(as at end-June)
market view
The average prime yield across Europe declined in Q2 2024.
-10bps
Cross border investors have underpinned around two-thirds of investment this year.
65%
Total investment fell by 14% y/y, dragged down by fewer portfolio deals.
US$9.5bn
The current vacancy rate in China, with tenants retaining strong pricing power.
27.9%
As the only net-buyers across the major investor groups, cross border investors have increased market share from 2023.
37%
Total investment fell by 34% y/y in Q2, but this followed a strong start to the year.
US$8bn
regional outlook
Head of Global Cross Border Investment
Rasheed Hassan shares his view on the market
An increasing number of markets globally are now unquestionably experiencing a tilt to the positive. In the major markets, with the exception of Japan, interest rates have largely peaked or are at the tail end of their journey, and we are now witnessing the start of eagerly anticipated rate cuts. We are also through a number of the major global elections. Whether investors support the outcomes or not, this provides a level of clarity that they all crave. Lastly we have been on a journey of price falls, pretty unanimously, across geographies and sectors. These now seem to be slowing and in some cases starting to turn. Given all of this, it is not surprising that we are seeing some investors looking at markets with more intent, and finding ways to be more positive in their underwriting. We have often reported that this has been an anomalous downturn, whereby rising rents for prime assets in core locations, including in offices, is set against a backdrop of falling values. This has given the market a strong conviction that this downturn is largely interest rate driven rather than fundamentals driven. Given where we are in monetary policy cycles, things should be looking up from here. There remains a shortage of committed vendors across all sectors, as the majority of owners want to wait until there are more datapoints to provide strong pricing
comparables. However, this is coming and it gives us hope that the busy end of year trading season will give the markets what’s needed as a backdrop for greater activity in 2025. The cap rate vs. cost of money conundrum remains a cause for reticence for some core investors. However, buyers with a long hold horizon are viewing today’s core market pricing as largely ‘fair value’ and those with shorter term strategies are focusing on total returns. The demonstrable and forecast rental growth is a key factor in decision making for the total return buyers, coupled with a belief that the most core assets in the best locations will always be considered scarce and therefore have a deep buyer pool that will keep yields as compressed as possible when it comes to exit. There is also a belief that the pricing disparity between truly prime assets and those with some sort of blemish (location, building quality, lease term, tenure) is too great and will narrow as the markets re-gain confidence. Lastly, I would note that the shortage of investment product is leading to greater buyer interest when something does actually come to the market. In many cases, this is supporting more aggressive underwriting, as those buyers who truly want to get invested know that they have limited choice. As a result, we are seeing a number of processes resulting in more positive pricing outcomes than expected. If owners are considering sales in the next six to 12 months, they may give consideration to bringing assets to the market sooner rather than later, taking advantage of the lack of choice that investors are having to grapple with.
Sign up noW